Content
PHP Profiling
When working on embedded controllers, profiling is pretty straightforward. There is a simulator, capable of counting CPU clock cycles accurately, so after each code change one can look at this count and see even tiny consequences reliably. 100 times 0.1% faster means 10% performance gain. Nice.
With PHP on a complex multitasking system it's not that easy. As one can easily demonstrate:
$ TIMEFORMAT='%3U'; for I in {1..5}; do
>   time curl http://localhost/thirtybees/ >/dev/null 2>&1
> done
0.015
0.011
0.011
0.005
0.009
The very same call takes between 5 ms and 15 ms system time, that's a deviation of up to 200%. Performance depends much more on luck (peripherals, other tasks running, network status, …) than on code quality. Totally unusable for evaluating benefits of small code changes.
Enabling the Xdebug Profiler
First thing is to install required packages. On Debian/Ubuntu, that's
sudo apt-get install xdebug kcachegrind
Then, xdebug.ini needs some editing. On Debian/Ubuntu that's /etc/php/7.3/apache2/conf.d/20-xdebug.ini, where 7.3 is the PHP version used by the web server. Add these lines:
xdebug.profiler_enable_trigger=1
xdebug.profiler_output_dir=/tmp
# Options see https://xdebug.org/docs/all_settings#trace_output_name
xdebug.profiler_output_name=cachegrind.out.%u
Then restart the web server:
sudo service apache2 restart
That's it already.
Getting Profiles
Again, fairly simple. Simply add XDEBUG_PROFILE to the URL. Which means,
http://localhost/thirtybees/
==>
http://localhost/thirtybees/?XDEBUG_PROFILE
or
http://localhost/admin-dev/index.php?controller=AdminDashboard
==>
http://localhost/admin-dev/index.php?controller=AdminDashboard&XDEBUG_PROFILE
Requesting such an URL generates the profile. That simple.
Analyzing Profiles
There's a little trick. Apache on Debian/Ubuntu runs in a sandbox, so these generated profiles don't end up directly in /tmp. They have to get moved out of the sandbox, ideally into the web directory root. Having them there automatically maps the code into the profile analysis.
cd /var/www/html/thirtybees # or wherever the web root is
sudo find /tmp -name \*cachegrind.out\* -exec mv {} . \;
Then one can launch KCachegrind for analysis:
kcachegrind cachegrind.out.1568123370_257736
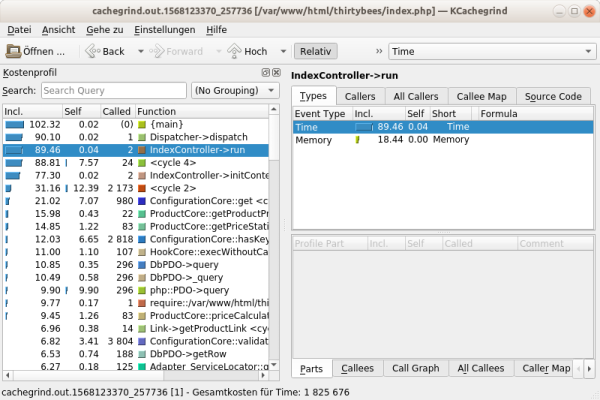
Voilá:
Noteworthy toolbar buttons:
'Relative'
Turning this on gives time and memory measurements not as absolute values, but as percentage of the total. Relative values are quite helpful, as accuracy considerations below will show.
'Time' / 'Memory'
Here one can choose between looking at time measurements and looking at memory usage measurements. Distinction should be obvious.
From here on everything is about time measurements, to simplify language. Memory measurements work accordingly.
Overview Columns
To the left in KCachegrind's window one can see a large table. Understanding what each column in this table means is crucial for identifying bottlenecks.
Important here is that one can click on a column title to sort by that column. One typically wants to look at code where most time is spent first, of course. Improving rarely used code makes rarely much sense.
'Incl.'
Incl. shows time spent in a function, including all other functions called inside. Time spent in multiple invocations of a function gets summed up. This is helpful for identifying slow code sections.
'Self'
Self shows time spent in a function without time spent in other functions called inside. This is helpful for identifying slow code in that particular function.
'Called'
Called shows how often a particular function gets called throughout the whole request. Performance improvements in a function multiply by that value. For example, speeding up code in a function called 4'000 times by 1 microsecond results in a 4 millisecond improvement total.
'Function'
That's the actual name of the function. Clicking on it changes the details display on the right of the overall window to that function.
Detail View
To the right in KCachegrind's window one can see a number of tabs. Playing a a large table. Understanding what each column in this table means is crucial for identifying bottlenecks.
Accuracy Considerations
Initially was shown how performing distinct runs, and looking at the overall measurement only, results in wildly distinct performance measurements. Let's see whether a dedicated profiling tool can do better.
Total Time
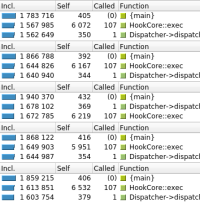
These results are from 5 consecutive, identical page requests, photoshopped together.
As one can see, measurements are still not identical to the CPU clock, but variations are much smaller. Deviation between smallest and largest value is no longer like 200%, but just about 8%.
Relative Time
These are the results of the same 5 requests, in relative view. {main} being above 100% is a rounding error, of course.
These deviate by like 1% at most, which is probably as close as one can get on a multitasking system. Improving performance by just 2% should be clearly visible here.
That said, knowing where the time is spent is usually much more important than numbers of totals. And there Xdebug's profiler together with KCachegrind gives very good hints. This way one can watch out which functions get called more often than expected, how costly a single feature is, or where it makes sense to squeeze out the last bit of performance.
Mission accomplished!
Now back to coding …


